
Car valuation tool that offers data-driven knowledge that lets you predict spikes and dips in your car’s value.
You won’t just learn what your car is worth today, but what it’ll be worth tomorrow, so you can position yourself to sell or buy at the perfect time.


My Role
Product Design
UX Research
Data Visualization
Artificial Intelligence
In our industry-partnered project with Carputty, I played a key role in the redesign of the Vehicle Value Prediction Tool. Leveraging user insights and competitor analysis, I focused on boosting trust and visualization in AI-generated results for car transactions.
My contributions included leading user interviews, ideation, creating conceptual sketches, wireframes, and developing a high-fidelity prototype with advanced features. I led heuristic analysis, and user-based testing, exceeding expectations and achieving substantial improvements in user engagement and trust.
Throughout the collaboration, I worked closely with stakeholders, incorporating feedback and aligning with business goals. This collective effort resulted in significant improvements in user engagement and trust in AI predictions, showcasing my ability to contribute effectively within a team. This project highlights my impactful role in collaborative, results-driven initiatives.
Teammates
Jisu Kim
Meghna Kaligotla
Sangha Park
Ziyi Shao
Duration
4 months
Time
June 2023
Tools
Figma
Adobe Suit
Qualtrics
Notion
Optimal
Problem Statement
How might we equip individuals interested in buying/selling a vehicle to make informed vehicle purchasing and selling decisions by...

Enhancing the data visualization reliability and explainability of Carputty’s V3 Valuation tool

Providing user education

Understanding what our users value in their vehicles and reflecting that in the valuation tool
Solution

Optimized Home Page Experience
Home Page Redesign
Enhanced the visual appeal and functionality of the home page.
Tool Description
Introduced a concise yet informative description of the tool prominently on the home page.
Enhanced Accessibility
Enabled seamless valuation tool access through both the navigation bar and a strategically placed button for users.
User Onboarding with V3 Tool
V3 Tool Overview
Brief explanation of how the V3 tool works.
Convenient Input Options
Options for users to input car details through VIN, license plate number, or make and model.
Testimonials
Incorporated user testimonials to showcase the effectiveness and positive experiences with the V3 tool.
Enhanced Vehicle Information & Condition Data
Detailed Input Options
Allow users to input specific car details and condition for a more accurate valuation.
Integrated Visual Data
Enhanced precision by integrating visual data, such as images, into the AI tool.
User Guidance with Tooltips
Minimized confusion and streamlined user experience by adding tooltips to provide guidance throughout the valuation process.
Valuation Tailored to Your Preferences
Personalized Date and Valuation Period
Option to customize the date and valuation period based on user preferences.
Enhanced Transparency
Build trust in the result by highlighting the significance and impact of each feature on the car's value, fostering transparency.
Feature-Specific Valuation
Tailor the valuation by adjusting the value of individual features, observing the direct influence of each change on the overall value.
Enhanced Tool Features
Save to Garage
Save cars to the garage for later access or comparison with other vehicles.
Download Options
Download valuations in versatile formats like CSV, PDF, or others for easy reference and sharing.
Watch List with Alerts
Add cars to the watch list and receive alerts about predicted price fluctuations, keeping you informed about market changes.
Comprehensive Garage
Unified Car View
View all interested and owned cars in one centralized location for easy management.
Interactive Comparison
Compare the values of different cars stored in the garage to make informed decisions.
Personalized Ranking
Rank cars based on personal preferences and explore the preferences of other users.
Textual Insights
Receive a detailed textual summary of the chart, market trends, and valuable suggestions.
Smart Suggestions
Get recommendations for cars within similar categories and price ranges, tailored to your preferences.
Collaborative Garage Access
Share access to the garage with other members for a collaborative car management experience.
360-Degree Car Inspection
360-Degree View
Explore comprehensive exterior and interior views of the car in 360 degrees for a thorough assessment of its condition.
Touchpoint Analysis
Identify specific touchpoints that have influenced changes in the car's value, providing insights into valuation fluctuations.
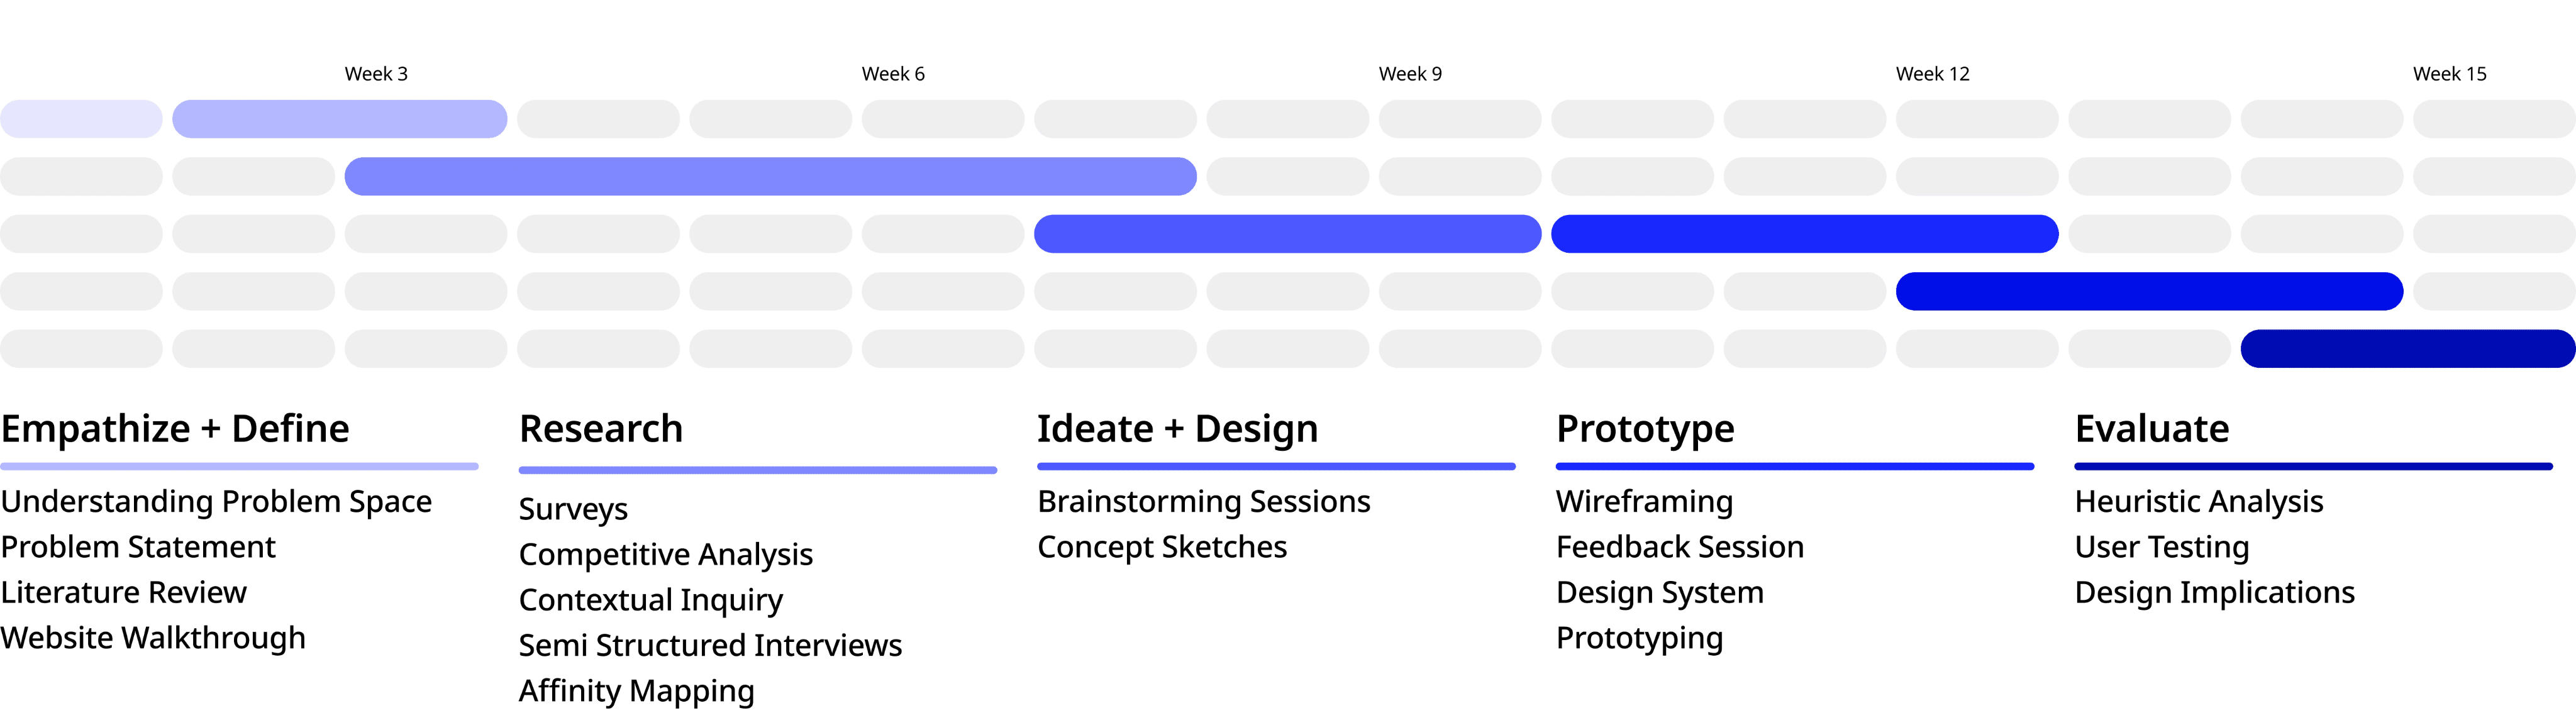
Project Timeline
Research Questions
What are the current challenges with the V3 valuation tool?
Why and when do users use valuation tools?
What is the definition of
“a good car”?
Website Walkthrough

We conducted a website walkthrough to understand user experiences and identify any challenges in navigation, confusing elements, and user preferences. This walkthrough helps us enhance the website's user-friendliness and improve overall user satisfaction.
Key Insights
Challenges in Locating V3 Valuation Tool:
Difficulty in finding the "V3 Valuation Tool" on the website, resulting in usability issues for users.
Unclear Website Focus:
Lack of prioritization leading to ambiguity about the website's core offerings.
Literature Review

How to build Trust in AI models?
Trust is critical in user interactions with AI models, influencing decisions.
Users show "algorithm aversion" when trust is lost after errors and "automation bias" when relying on algorithms despite potential inaccuracies.
Machine learning systems face challenges due to a lack of transparency, known as "black box" scrutiny.
Inherent uncertainty in ML systems leads to unpredictable outcomes, not always captured by testing before deployment.
Participants tend to trust machine predictions more with accompanying accuracy statements, even if accuracy is low.
Explaining individual attributes' contribution can enhance trust and decision-making in AI-assisted scenarios.
Addressing transparency and uncertainty is crucial for effectively fostering trust in AI systems.
How to improve explainability in Visualization?
Counterfactual Explanation Visualization: Depicts alternative scenarios resulting from changes in input variables and their impact on predictions.
Machine Predictions on Similar Data Points: Enables users to understand patterns and reasons behind outcomes by comparing predictions on similar instances.
Highlighting Minimal Changes: Clearly visualizes the smallest alterations needed to reverse a machine prediction, revealing influential factors.
Attribution Visualization:
Importance of Each Feature: Emphasizes the significance of individual features in predictions through visualizing feature importance.
Contribution of Each Feature: Breaks down the impact of each feature on overall predictions, providing a detailed understanding of their influence.
Displaying Corresponding Probabilities: Enhances interpretation by showing probabilities associated with specific attribute values, aiding users in gauging the likelihood of feature impact on predictions.

Competitive Analysis
We analyzed competitors like Edmunds, Kelly Blue Book (KBB), and Carmax to identify usability issues and effective design elements.


Key Insights
Unique Visualizations:
Carputty offers unique visualizations but falls behind competitors in information access, explainability, and data reliability.
Valuation Details:
Lack of prioritization leading to ambiguity about the website's core offerings.
Post-Valuation Features:
Carputty misses saving options and assessment range displays post-valuation.
Survey
The survey was conducted to gain insights into potential user demographics and preferences, and assess factors defining a good car for both individual buyers and Turo hosts.
We analyzed a total of 25 responses: 22 individuals and 3 Turo hosts.

Information that user would be able to provide readily.

When do you feel like you need to know the value of a car?
Key values individuals consider when purchasing a vehicle.

Contextual Inquiry
We conducted a contextual inquiry to observe how users engage with the Flexline application and V3 Valuation tool in real time.
Observing users during the car buying and credit check process provided insights for optimizing tools and enhancing the overall experience. Two participants with direct car buying and financing experience were involved
Key Insights
Difficulty in Locating the Tool:
Users faced challenges locating the valuation tool on the website, suggesting visibility or navigation issues.
Confusing Tool's Purpose:
Users found the tool confusing, signaling a need for clearer descriptions and explanations of its objectives and functionality.
Pre-purchase Access Preference:
Participants preferred using the valuation tool before car purchases, highlighting its crucial role in their decision-making process.


User Interview
We conducted interviews to gain insights into diverse user car preferences, understand reasons behind V3 valuation tool usage, and identify areas for improvement. Participants included 2 individuals experienced in car buying and financing, as well as a Turo host with 6 years of experience and a fleet of 5 vehicles.
After conducting interviews and think aloud sessions, we performed affinity mapping to group issues in order to obtain a set of problems we should cater to.

Affinity Mapping


Key Findings
User Interface:
Ensure easy accessibility of the valuation tool on the website for users.
User Input Options:
Offer alternative methods for users to input vehicle information beyond VIN and mileage.
Tool Clarity:
Provide clear information on the purpose of the V3 Valuation tool.
Reliability Assurance:
Communicate assurance and clarity regarding the reliability of the V3 Valuation tool.
Market Trends Understanding:
Provide insights into market trends during vehicle transactions for informed decision-making.
Collaborative Decision-Making:
Facilitate user collaboration by allowing them to involve others in their car-buying decisions.
Comparison Feature:
Implement a feature enabling users to compare prices and values of different cars easily.
Individualized Prioritization:
Incorporate a feature allowing users to prioritize different values in a car based on their individual circumstances.
Visual Indicators Clarity:
Ensure clarity on visual indicators, such as triangles, in data visualizations for user understanding.
Testimonials Reference:
Enable users to reference testimonials when making vehicle purchases.
Personas

Jordan seeks a second car with a focus on reliability and value, preferring clear and trustworthy car valuation. Frustrated by website complexities, Jordan values simplicity and credibility in the car-buying process.

Will, a Turo host managing a fleet of 5 cars, seeks precise car valuation tools with a focus on forecasting future trends and industry events for informed buying, selling, and rental pricing decisions. Frustrated with unclear explanations, Will aims for tools aiding in profitability and investment returns.
User Journey

Design Requirements
Optimized Site Navigation:
Improve site navigation, emphasizing the valuation tool prominently.
Tool Clarity and Descriptions:
Clarify the purpose of the tool with concise descriptions or tooltips.
Enriched Data Points:
Enhance the tool with additional data points for comprehensive vehicle valuation.
Input Prioritization:
Prioritize inputs such as make, model, and license plate number for a more user-centric experience.
Visual Indicators Enhancement:
Revise visual indicators and incorporate legends or tooltips for improved user comprehension.
Transparent Data Sources:
Provide clear indicators of data sources and explanations for valuations.
Social Sharing Capability:
Allow users to share valuation results or grant tool access to others.
Customizable Parameters:
Offer customizable valuation parameters to cater to individual preferences.
Comparison Feature Integration:
Integrate a comparison feature within the tool for evaluating different vehicles.
Real-Time Market Trends:
Incorporate up-to-date market trend data within the tool for informed decision-making.
Concept Sketches

Home Page and User Onboarding
Access to valuation tool from the navigation bar and the banner.
A short description about the tool and its capabilities with how the tool woks.
Vehicle Information Collection
Choose the purpose: buying a new car, buying a used car, or selling, and receive tailored recommendations.
Provide additional car details for a more accurate valuation.
Compare values by adjusting parameters to understand their impact.
Select the desired period to view the car's value.

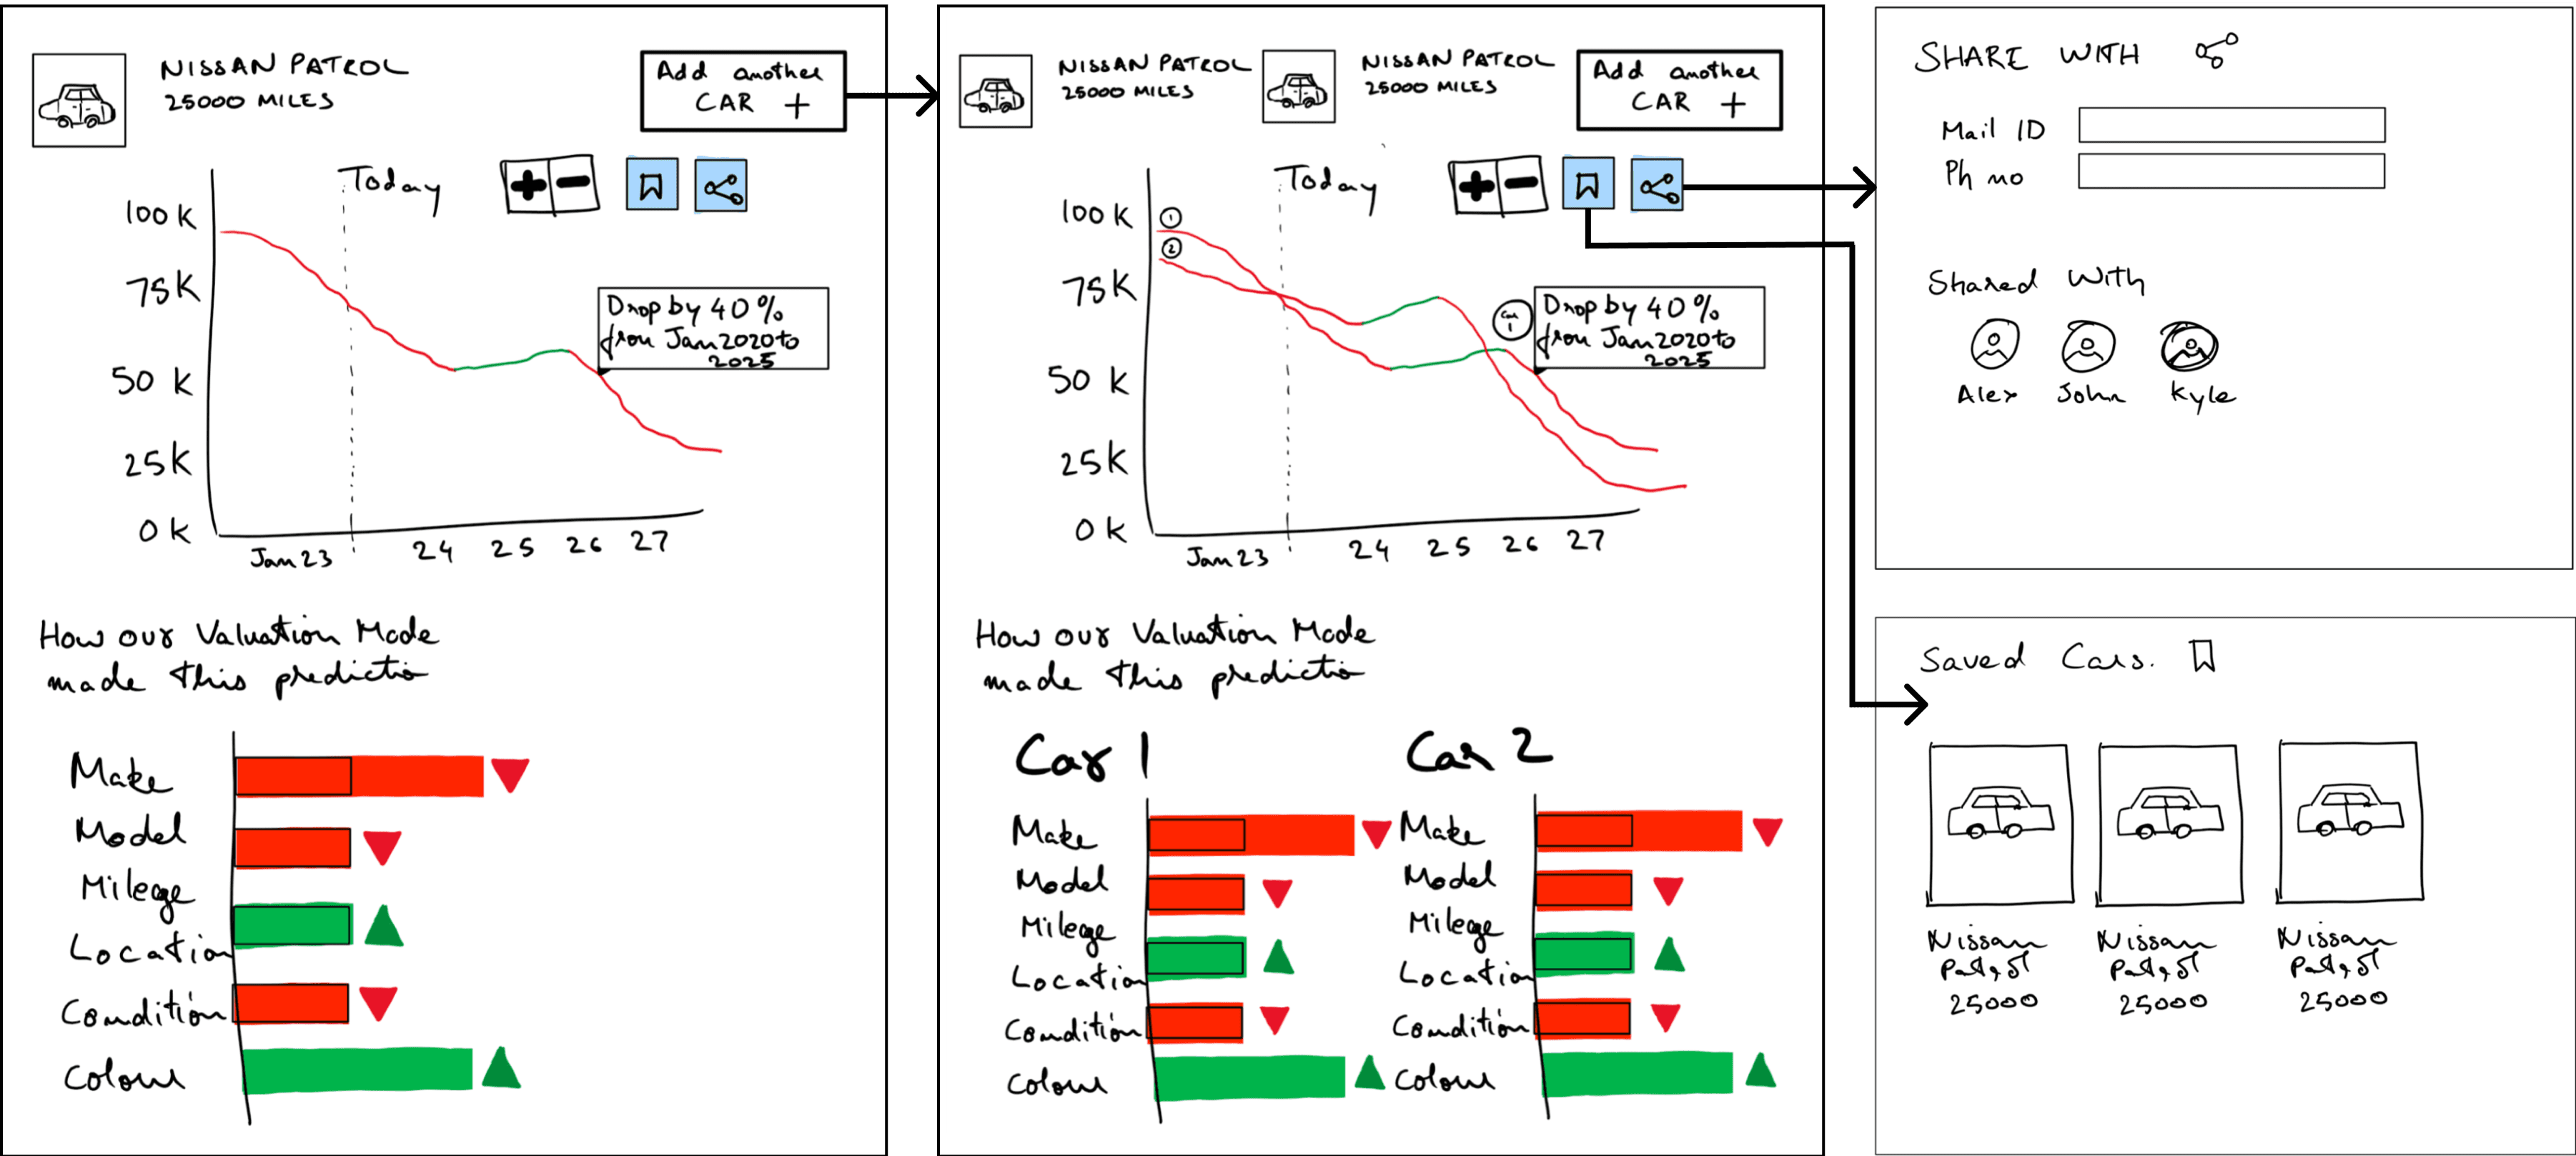
Data Visualization
View price trends with a color-coded graph indicating rises and falls.
Easily compare prices of multiple cars within the tool.
Hover over the graph to see specific price changes.
Access a chart illustrating how each factor influences the car's value, both positively and negatively.
Save cars to the garage and share valuations with others seamlessly.
360-Degree Car Inspection
Explore 360-degree exterior and interior car views to assess the vehicle's condition comprehensively.
Identify specific touchpoints that influenced changes in the car's value.

Concept Sketch Feedback


Wireframe


Design System


Final Design

Design Evaluation - Heuristic Evaluation
Three UX experts assessed our prototype against 10 Nielsen Heuristics, completing tasks and identifying usability issues.
Results
Evaluators identified mismatches between the system and the real world, especially on the Home and Valuation Output pages.
Two out of three evaluators identified a lack of user control and freedom, especially in adding a completely different car.

Specific Usablity Problems


Design Evaluation - User Based Testing
User testing involved 4 participants with diverse ages, professions, and tech savviness. Each session had 1 participant, 1 facilitator, and 1 note-taker. Researchers used 10 task scenarios, including 3 sub-tasks, tracking completion rate, time, clicks, and concluding with the System Usability Score (SUS).

Number of clicks for each task:

Task Completion Rate:

Other Important Findings:

Reflection and Learnings
Transitioning from Findings to Requirements
Formulating clear requirements from research findings presented a challenge, requiring a bridge from insights to actionable project steps.
Navigating Project Direction with the Client
Negotiating project scope and direction demanded effective communication and alignment with clients for mutual understanding and agreement on project goals.
Data Triangulation for Reliability
Integrating insights from surveys, interviews, and observations through data triangulation enhanced reliability and validity, providing a comprehensive perspective.
Understanding Usability Issues
Identifying and addressing usability issues was a critical step, essential for refining the user experience and ensuring optimal design.
Framing Survey and Interview Guides
Crafting focused and effective guides through thoughtful framing and questioning techniques contributed to meaningful survey and interview outcomes.